


An analyst has explained how the worst could be behind for Bitcoin, and Q4 may bring back bullish momentum if history is anything to go by.
Q3 Has Historically Been The Worst Time For Bitcoin Investors
In a new post on X, Capriole Investments founder Charles Edwards talked about how investors are going through the worst time for Bitcoin. Below is the table cited by the analyst, which breaks down the quarterly returns the cryptocurrency has seen throughout its history.
As is visible, the third quarter of the year has generally been the worst time for Bitcoin throughout history, with average returns for the month standing at +5% and median ones at -4%
For perspective, the second-worst performing quarter tends to be Q2, but its average and median returns of +27% and +7%, respectively, are still significantly better than Q3’s.
On the other side of the spectrum is Q4, the next quarter of the current year. Bitcoin has had its best periods this quarter, with average and median returns at +89% and +57%, respectively.
“If you are still here, congratulations. You made it through the worst time to be in Bitcoin,” says Edwards in the post about BTC traders. “The best lies ahead.”
Last year, the cryptocurrency enjoyed an uplift of almost 57% in this period. With Q3 fast approaching a close, it remains to be seen how the BTC price ends up performing in Q4 this time around.
Speaking of historical patterns, on-chain analyst Checkmate discussed how the daily price performance distribution has looked across bear and bull markets in an X post.
Here is the chart shared by the analyst:
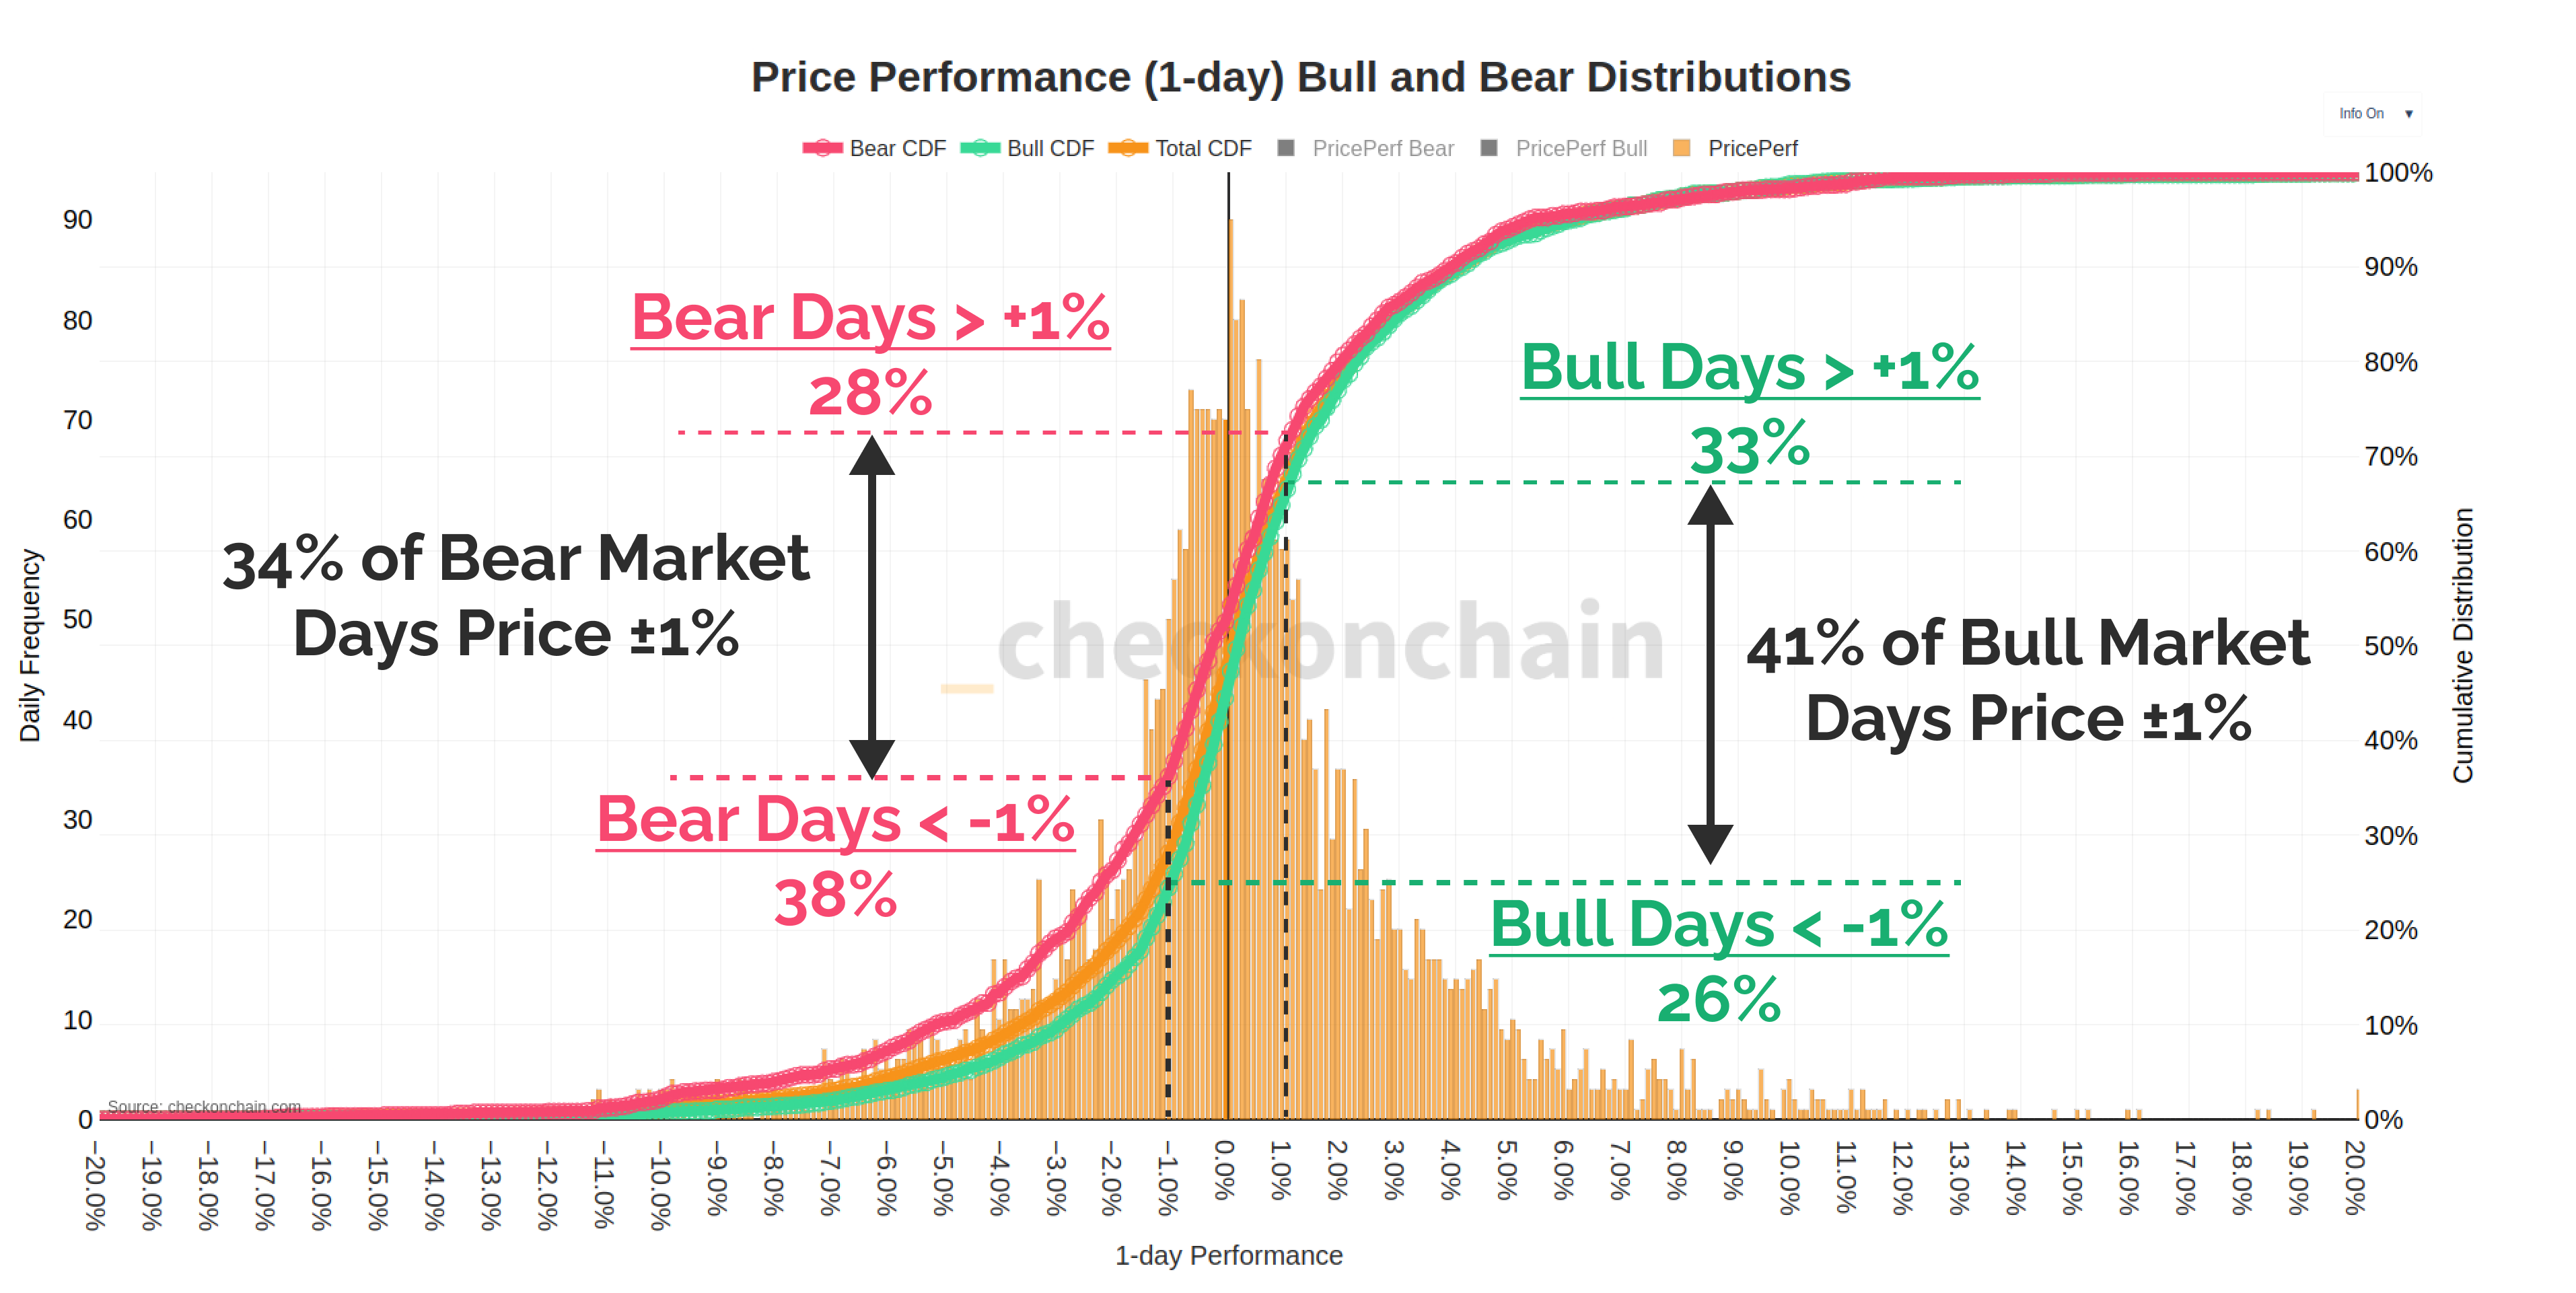
As displayed in the above graph, around 28% of bear market days have seen the asset trend higher than +1%, while about 38% have seen it decline by more than -1%. The remaining 34% of the days have seen the cryptocurrency remain within +1% to -1% of the previous day.
During bullish periods, Bitcoin has spent 33% of the days witnessing a rise of more than +1%, while 26% registering a drop of over -1%. The asset has consolidated for the remaining 41%.
The symmetry between the three types of days is interesting, but what stands out is how the distributions are almost the same between bear and bull markets.
“Day traders are attempting to beat a three-sided coin, with a third of all days rallying, a third selling-off, and a third doing nothing,” notes Checkmate.
BTC Price
Bitcoin has shown a sudden burst of bullish momentum during the last 24 hours as its price has jumped more than 5%, reaching the $60,900 level.